Softgarden has redesigned its reporting section and added a number of content & features.
New navigation on the left side
Throughout the reporting section you will find navigation on the left hand side: "Reports" section where you can choose between different dashboards, "Export" section where you can find raw data for download ("Snapshot") and as a data feed for integration into your in-house BI solution ("Continuous Reports").
With the new navigation, you always have all available topics in view and can effortlessly switch between dashboards and raw data.
Dashboards: Filter bar, explanation and data export per chart.
On each dashboard you will find a filter bar four drop-down menus:
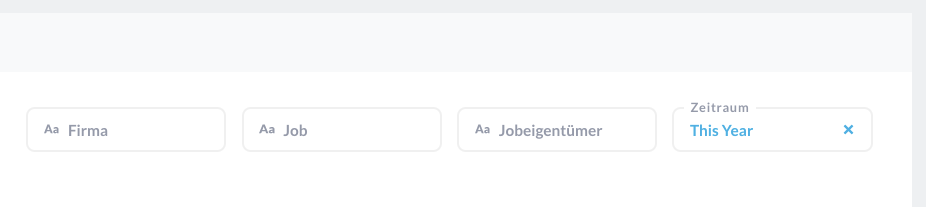
- Company: If your company is part of a group of companies, you can select one or more companies from this menu.
- Job: You can select one or more advertised jobs.
- Job owner: You can select one or more job owners.
- Period: You can select a reporting period
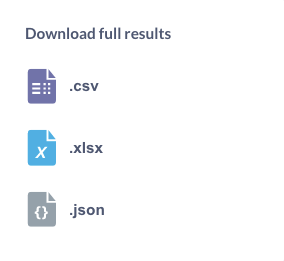
Behind each diagram headline there is a tooltip for explanation. In the upper right corner you can download the basic data of the diagram in different formats (.csv, .xlsx and .json) via the download icon.
New dashboards: Start page and applicant info
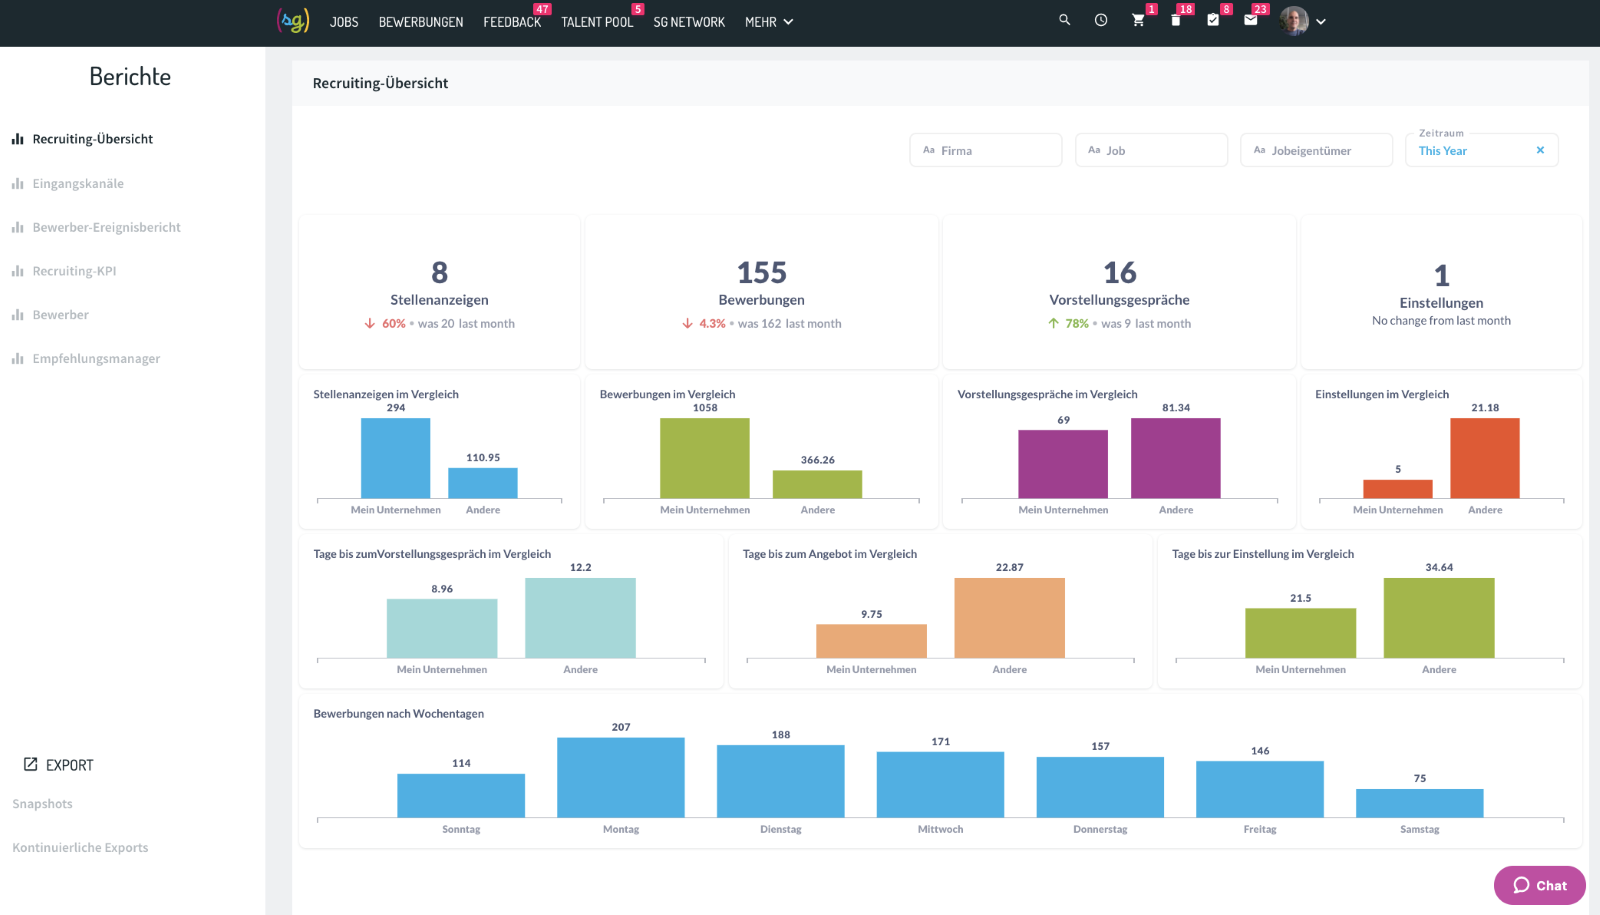
The start page is the entry point to the new reporting area. It shows the most important key figures at a glance. The distribution of your applications across the different application steps as well as the time to interview, offer and hire ("My company") are viewed for the respective key figure in direct comparison to the average across Softgarden customers ("Other").
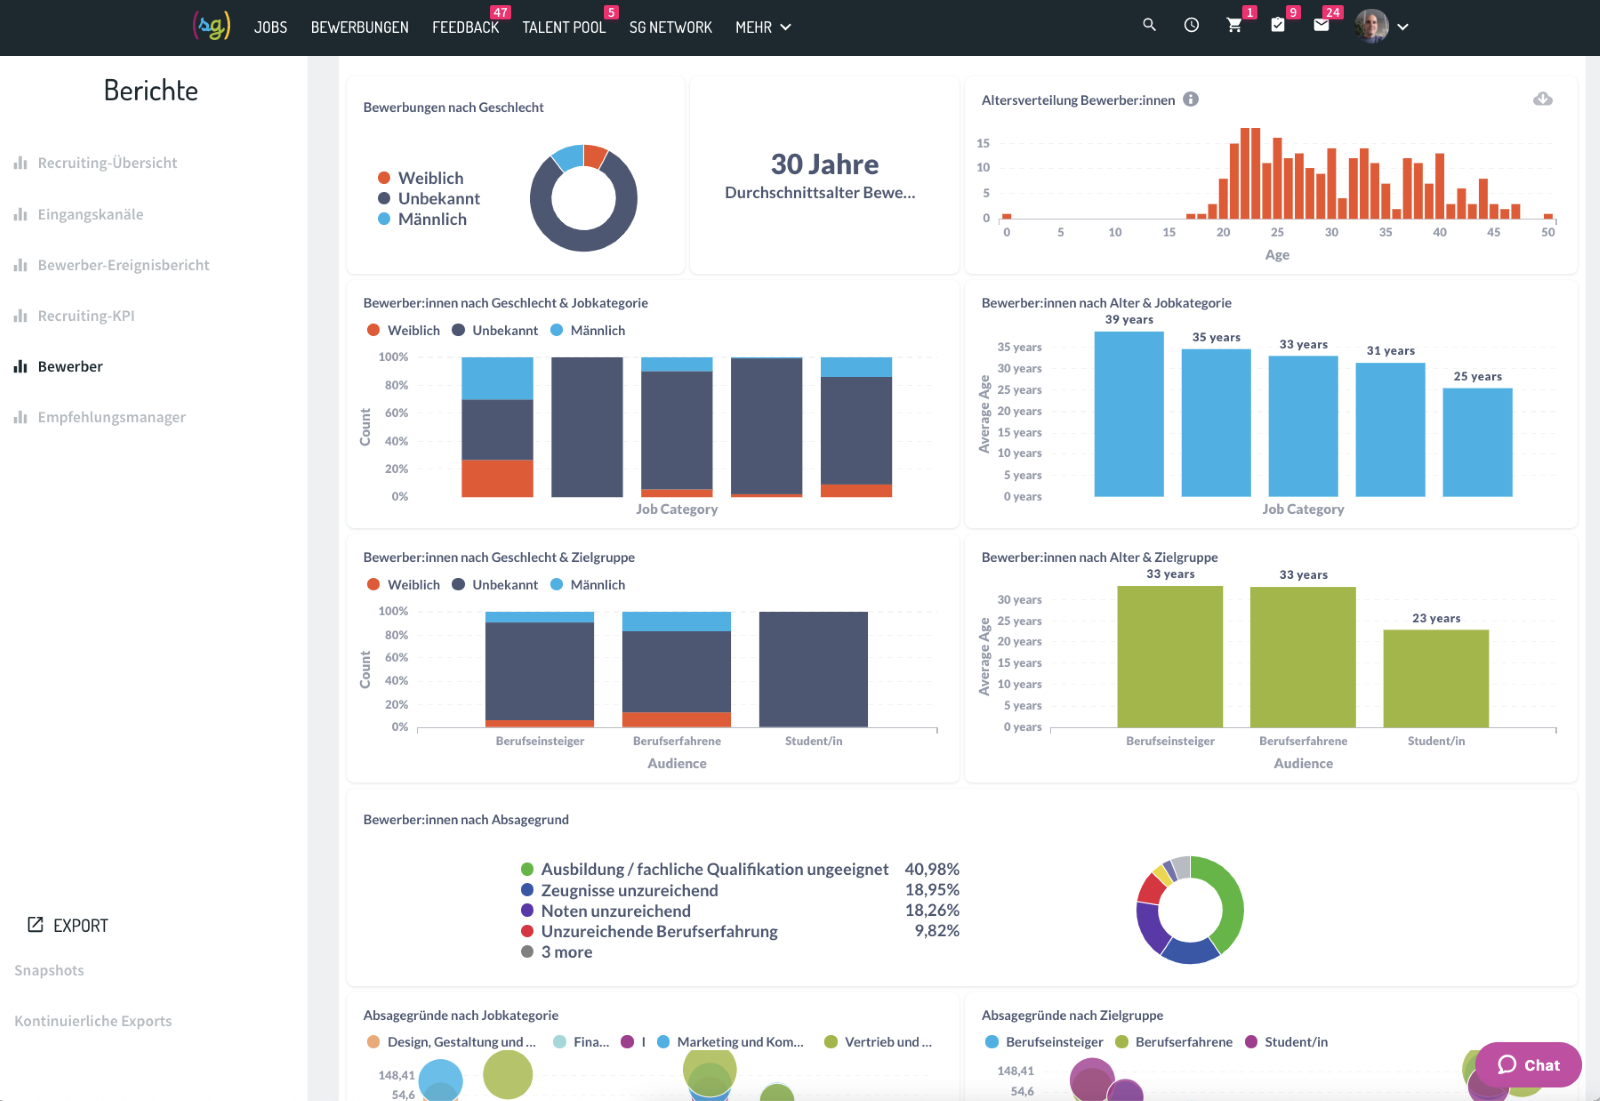
The Applicant dashboard shows the distribution of applicants by age & gender, also differentiated by job category and target group. In addition, there are the reasons for rejection, sorted by frequency, job category and target group.
Export "Snapshots": new fields in the raw data tables & new themes
Based on customer feedback, we have brought a number of content fields into the raw data tables to facilitate evaluation. In addition, there is the "ApplicationNumber" and the "JobNumber" which allow linking of the raw data tables.
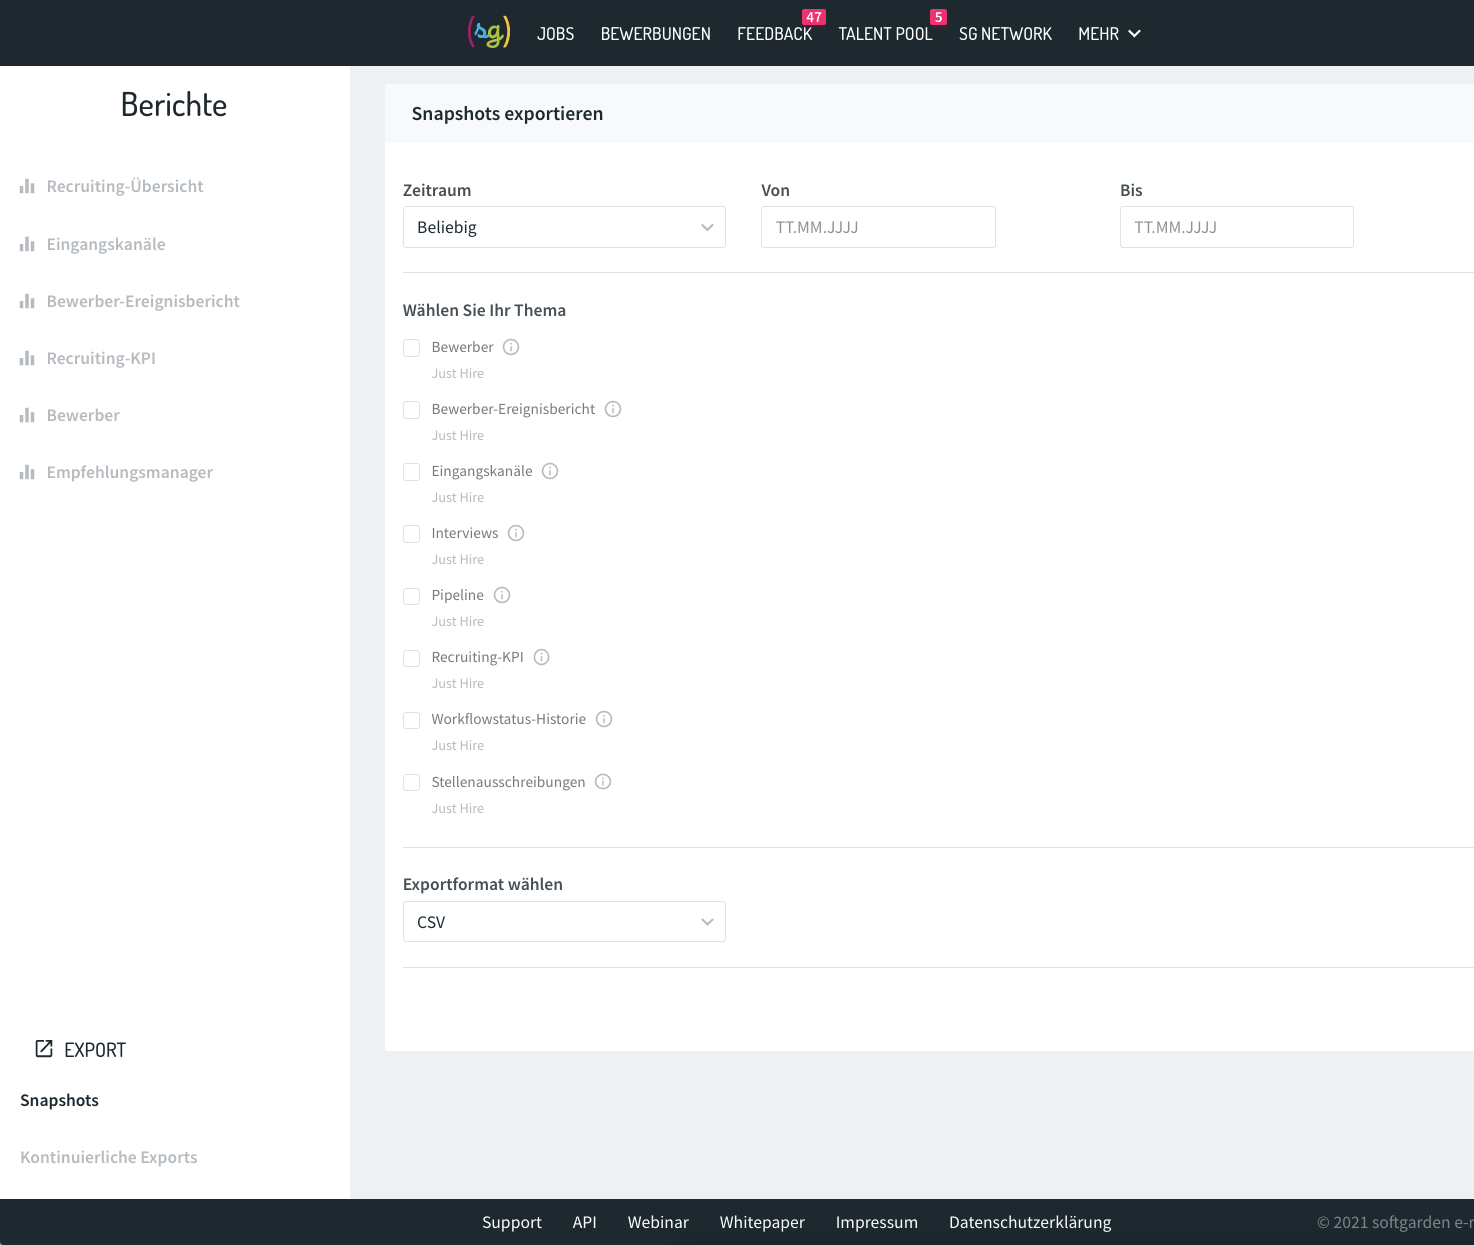
In addition to the optimisation of existing raw data tables, there are two new topics: The raw data table "Interviews" gives you an overview of all agreed interviews including date, entry channel, job owner and the number of days an application has been in the application system. In the raw data table "Workflow status history" you will find all available status changes per candidate. Their adjusted workflows are also taken into account.
Behind each raw data table title you will find a tooltip with the explanation of all available fields. For all topics in the "Snapshots" section, you can select an observation period and an export format (.csv, .xlsx and .json).
Data feeds for professional users
We have created the "Continuous Exports" area as a basis for your individual evaluations. Here you can subscribe to a raw data delivery via URL and define data format and export interval.
You activate the continuous export with the toggle and then receive the data according to your settings until deactivation. A separate URL is generated for each theme, which you can then use to integrate the raw data directly into your preferred software solution for further processing. Use the icon at the end of the URL to copy it directly to your clipboard.
Comments
Please sign in to leave a comment.